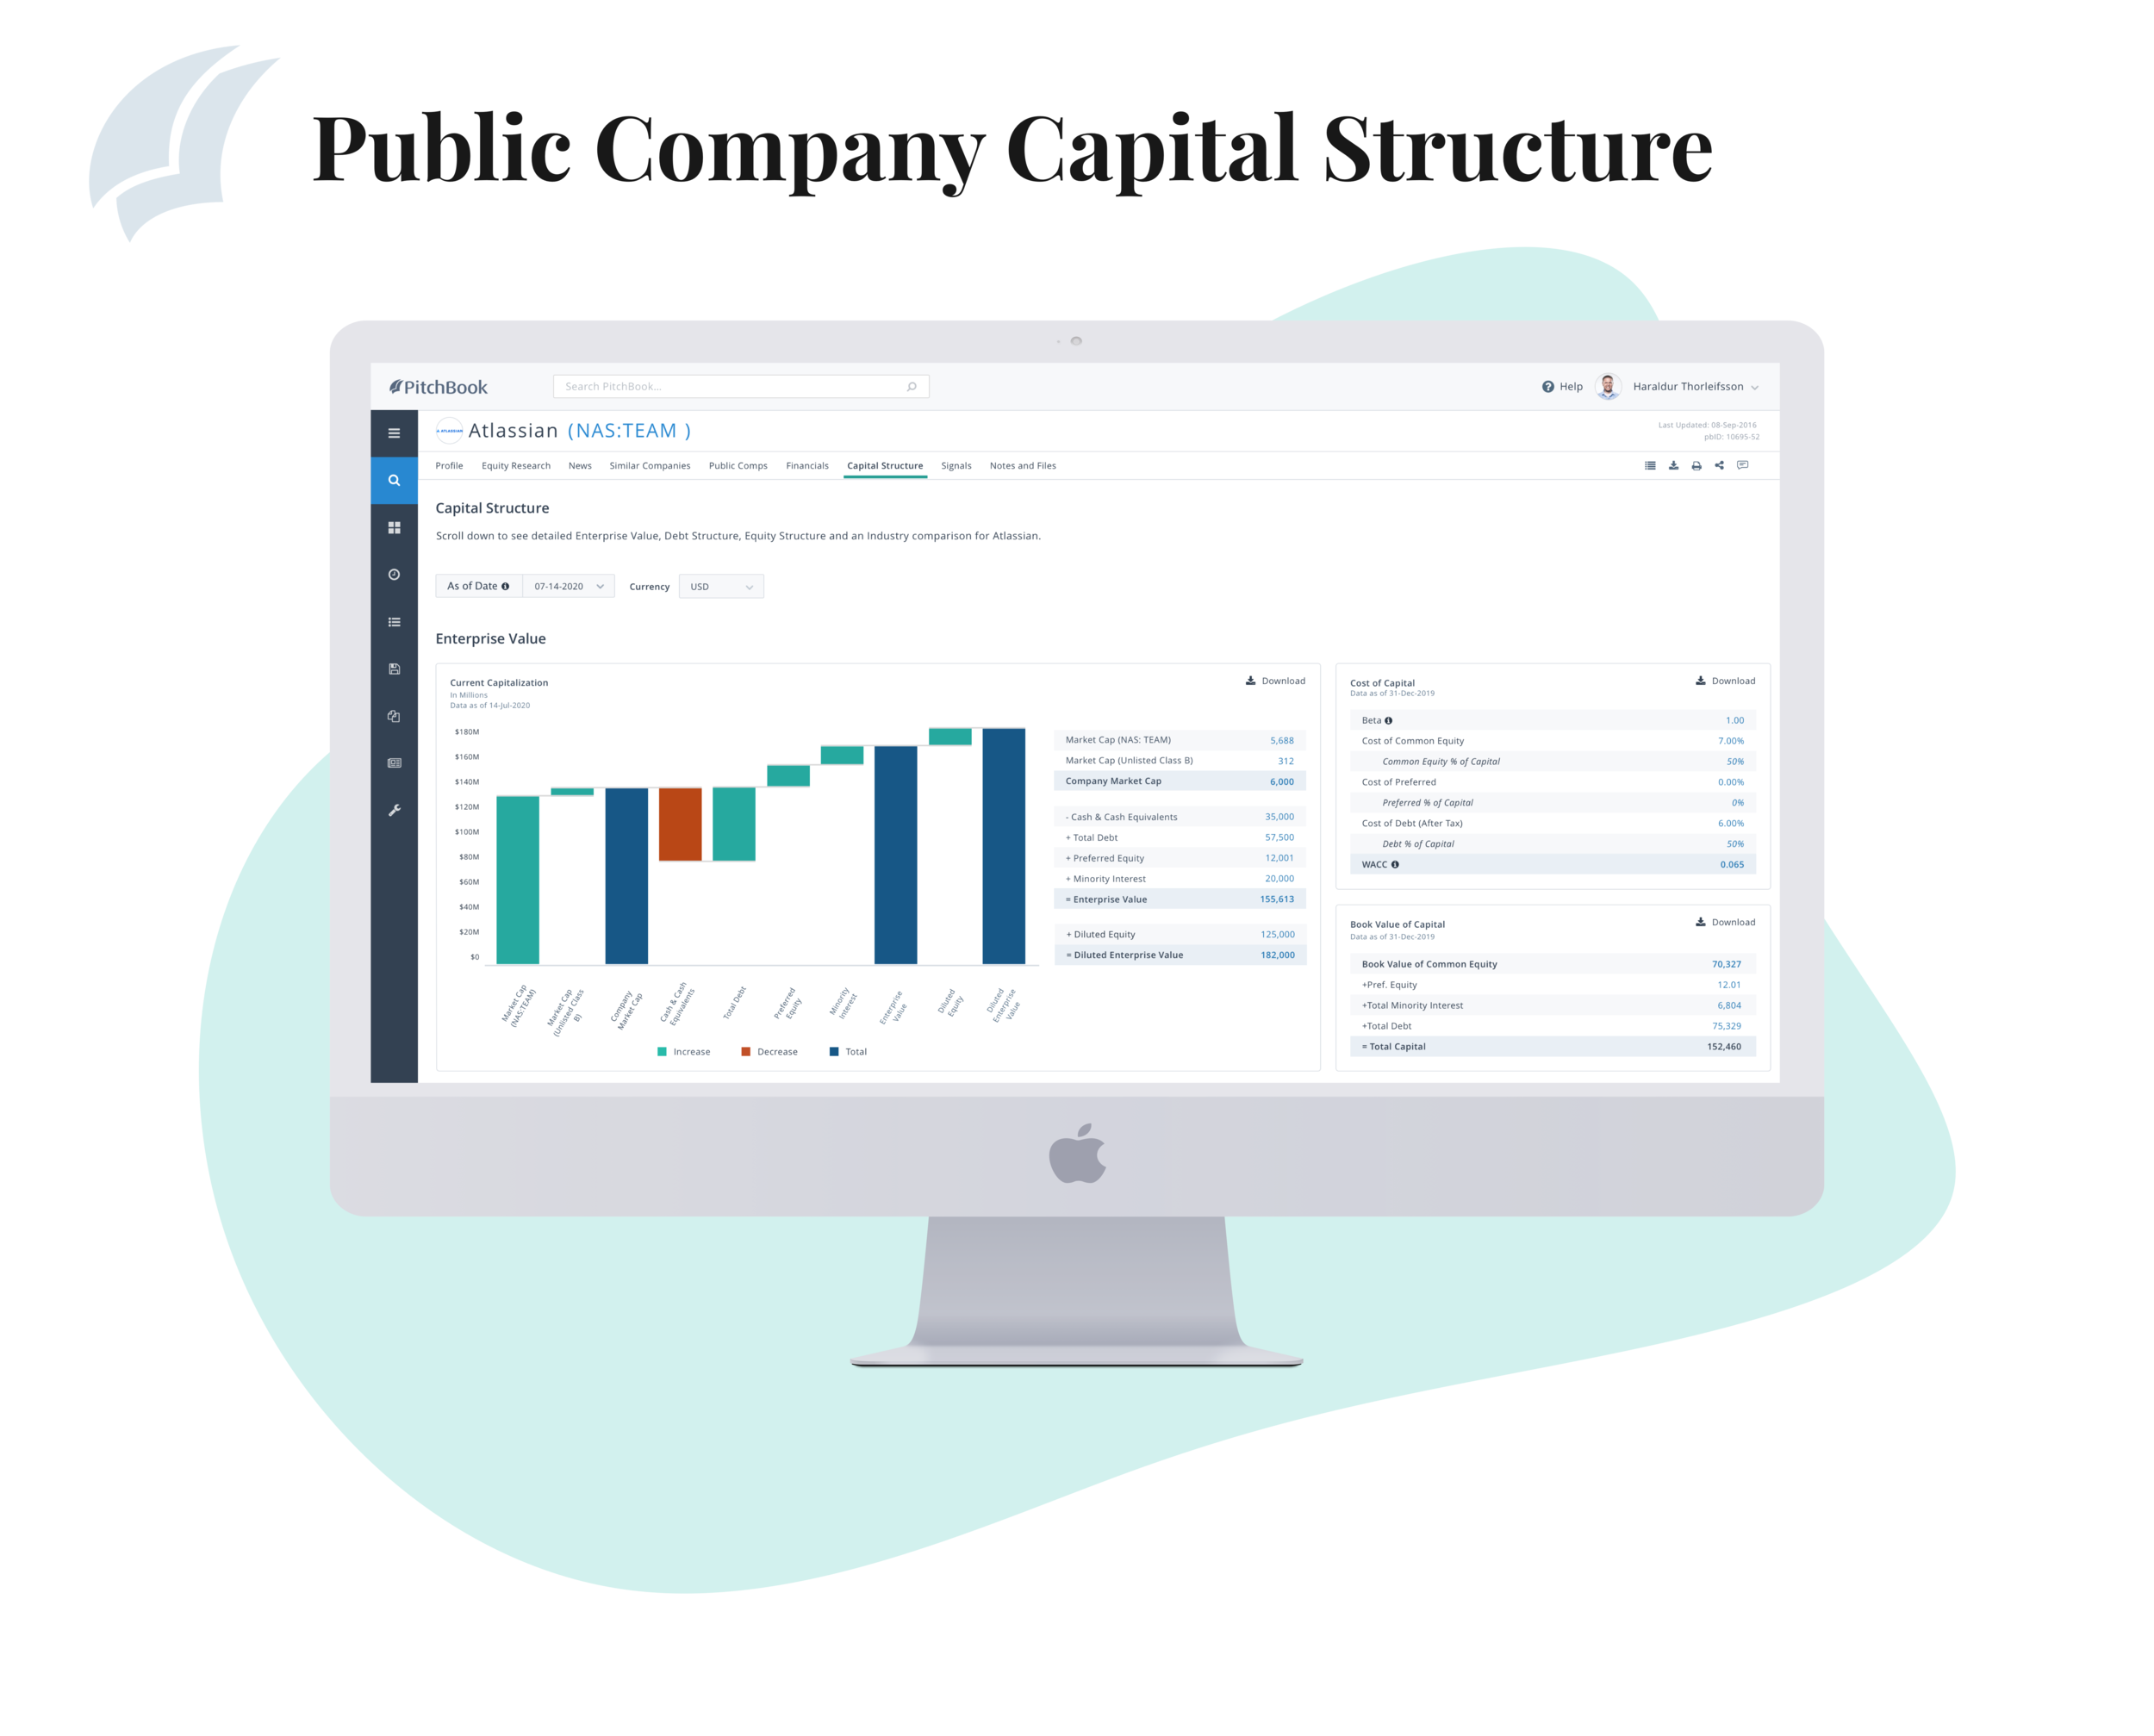
Capital Structure
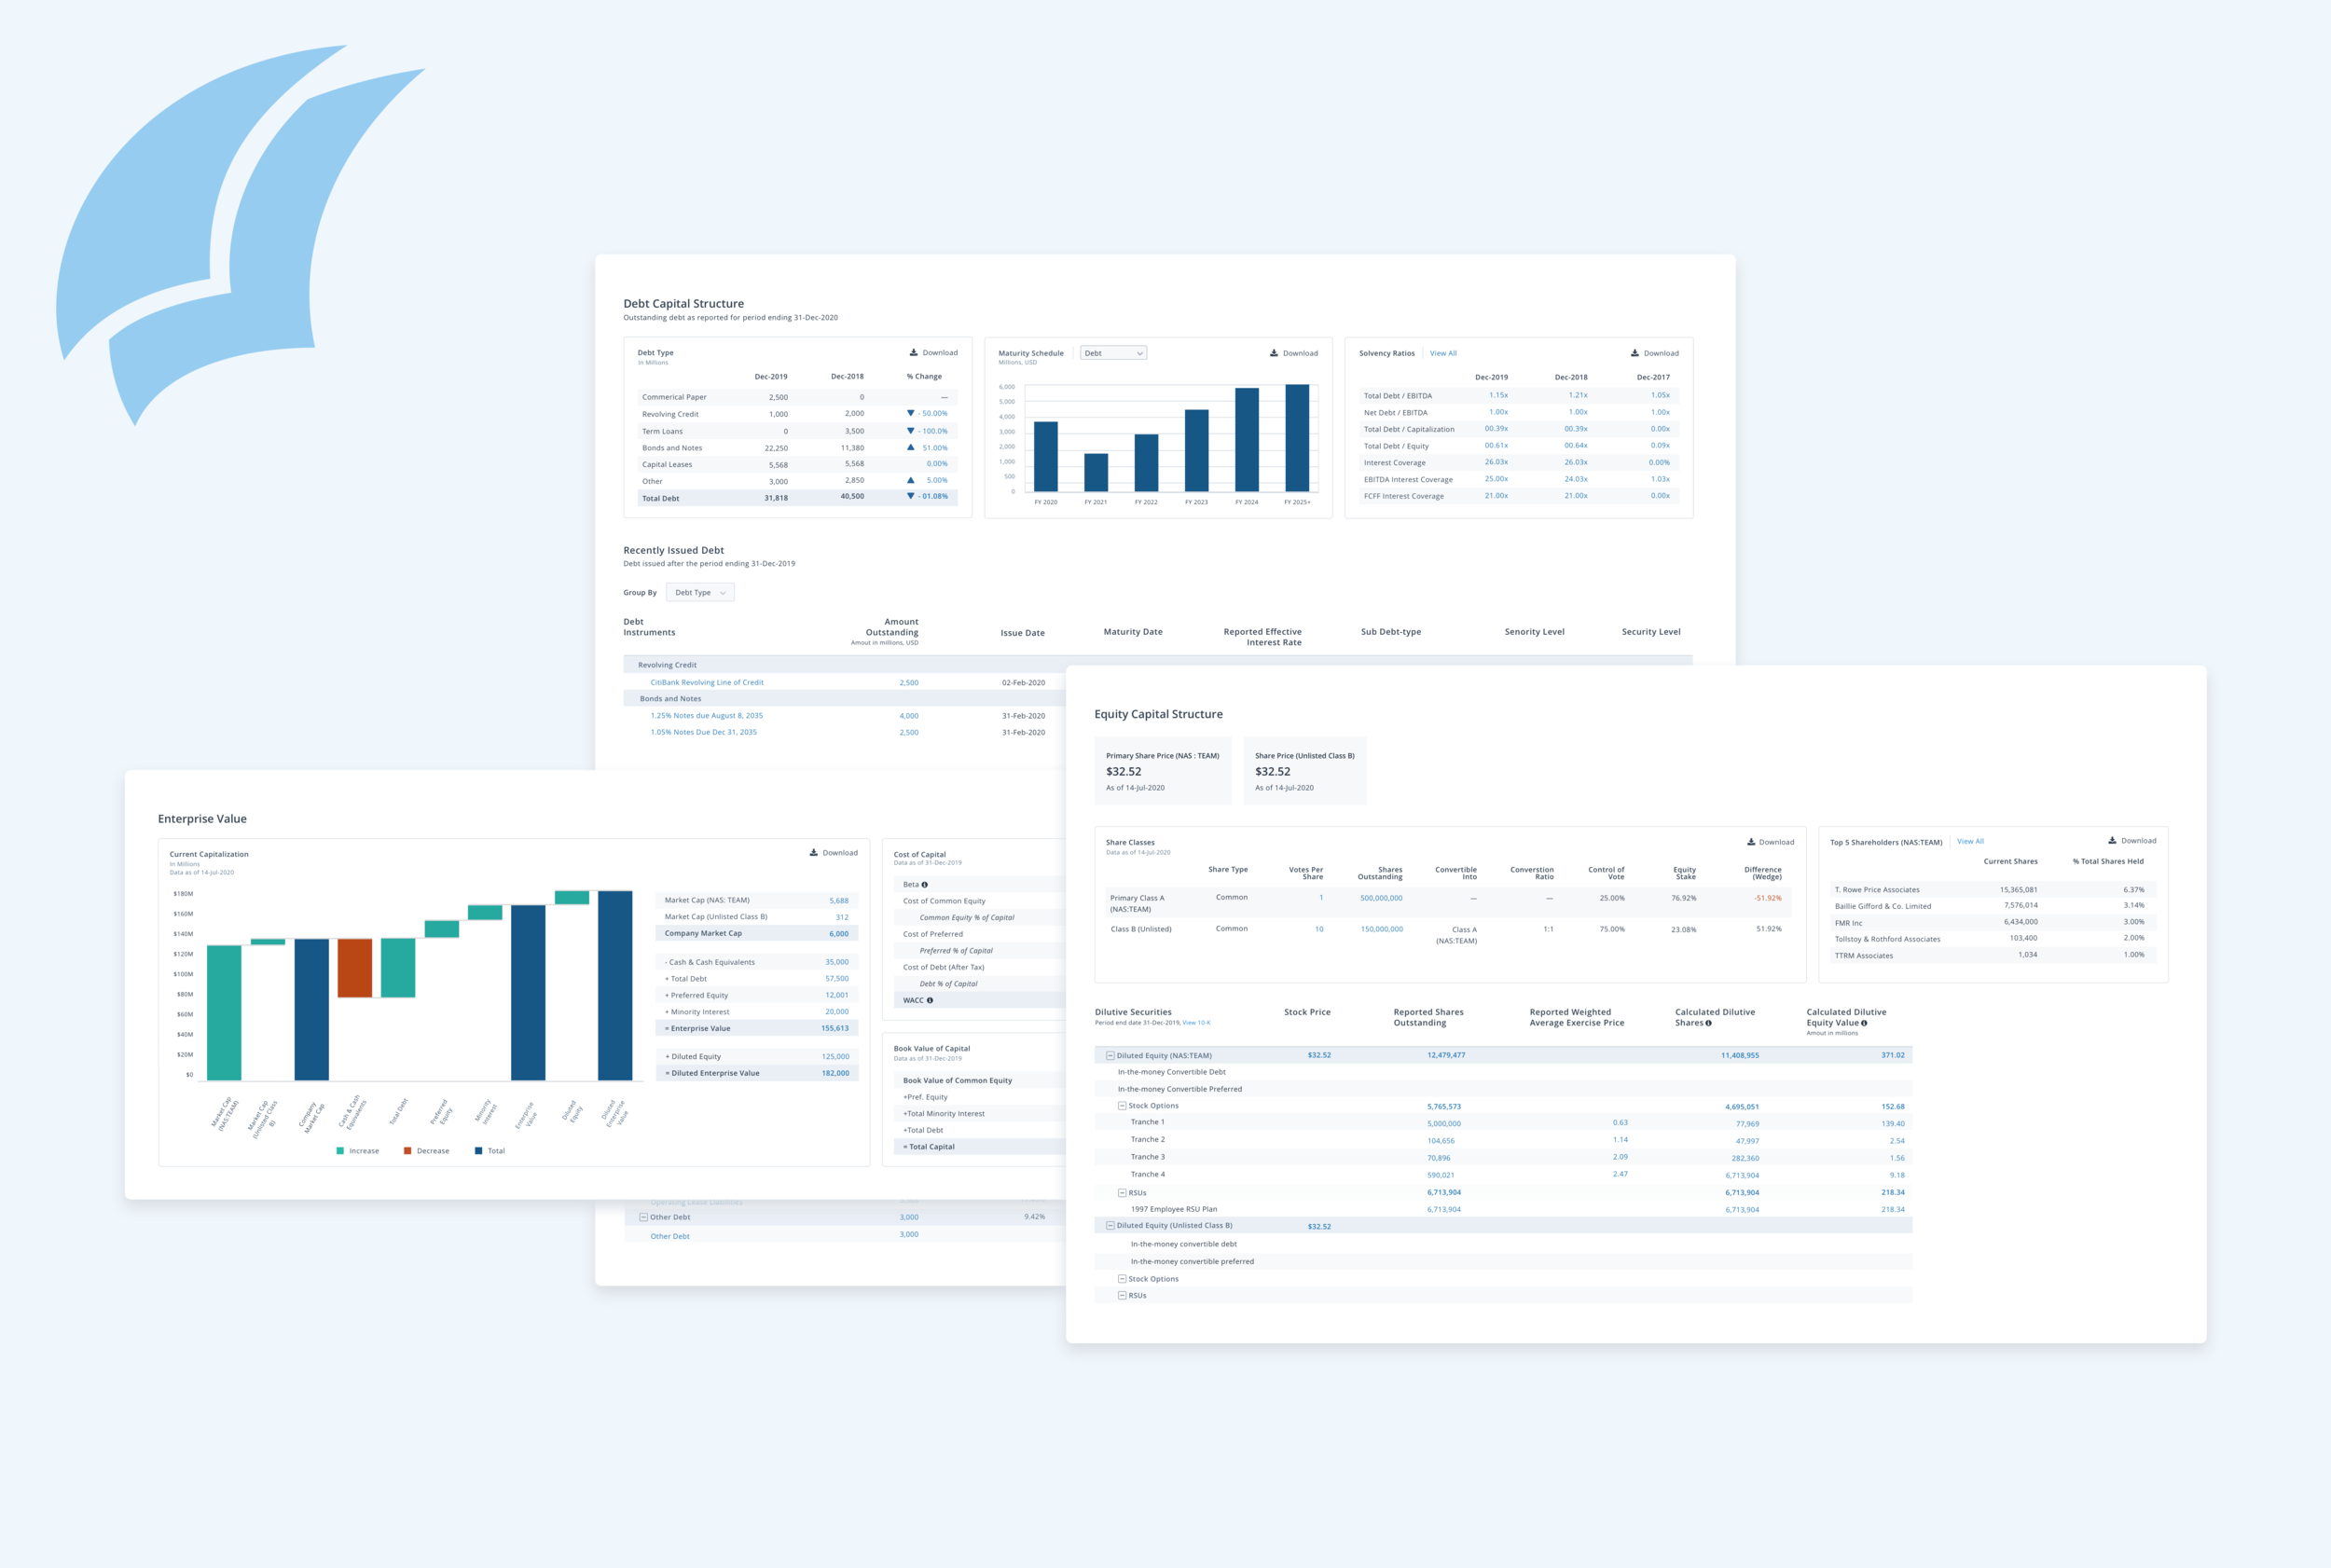
Capital Structure
PitchBook Data
The Capital Structure project took 9 months to produce.We expect to ship the feature in Q1 2021. I was the only Product Designer on the feature team consisting of 3 engineers and one Product Manager. This project consisted of some of the most complicated data methodology and design challenges I have faced to date. Here is a snapshot of my process.

Product KPI’s
1 Usage of the dataset. Clicks into tab, clicks within tab, downloads to Excel. Time on task.
2 Adoption of the dataset. % of users viewing tab. Saved lists and downloads from tab.
3 Retention of users on this product. Frequency and return rate.
4 Qualitative Feedback positive survey responses regarding usability and functionality. Low negative feedback submissions & related help desk requests.

Research
We began with an exhaustive academic study on the subject of capital structure starting with debt and its components. After gaining a base knowledge I interviewed 10 internal stakeholders and subject matter experts. Following those interviews we were able to host generative interviews with 6 clients.
Stakeholders
This was a unique project in that we interfaced not only with clients and internal stakeholders but also had to consider our Morningstar partners in data collection, sourcing and methodology at every stage.

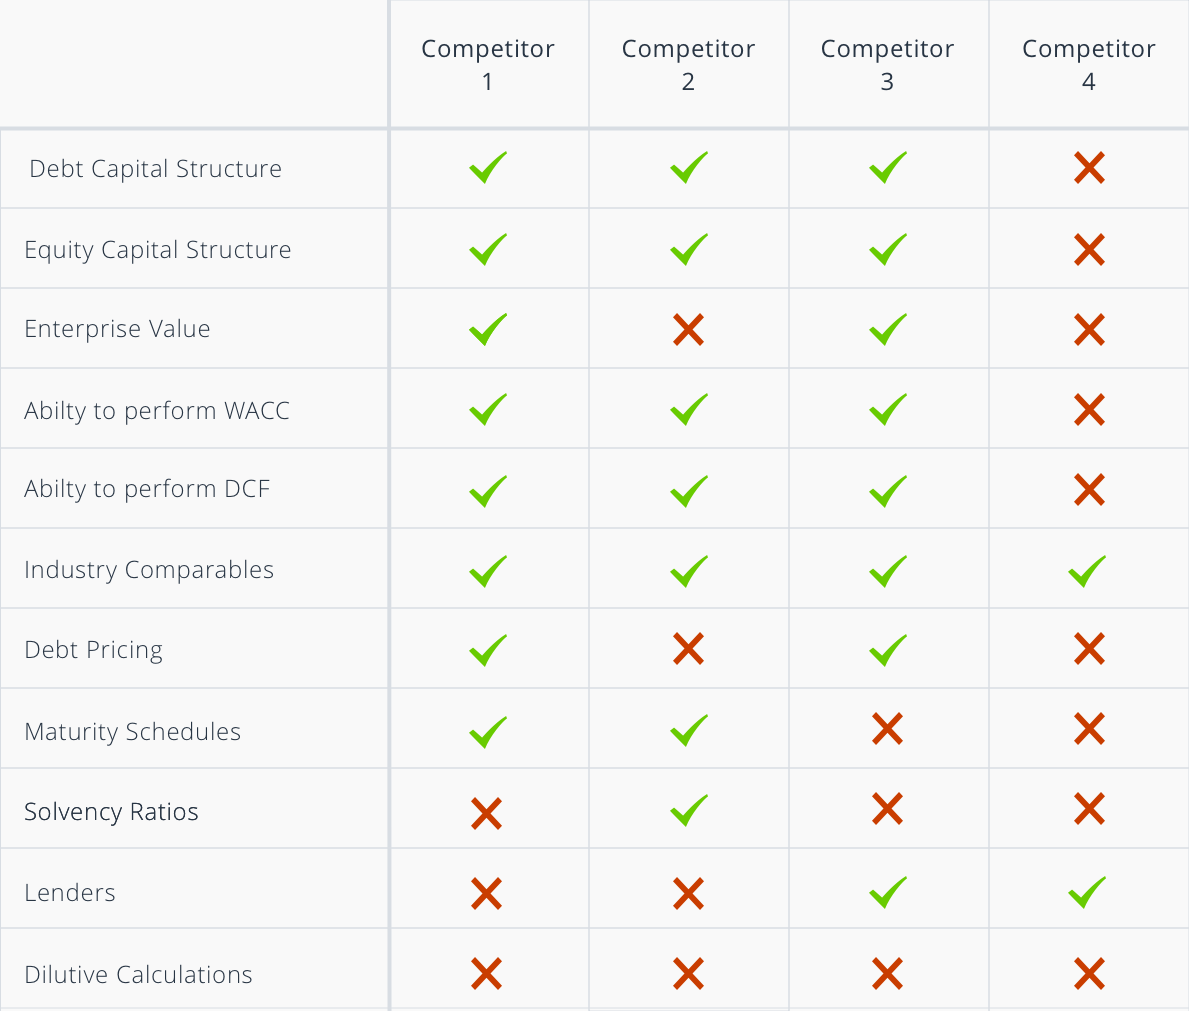
Competitive Analysis
Through competitive analysis we were able to do SWOT analysis and develop a feature that not only beat our competitors but goes far and beyond current capabilities.
Takeaways
Debt structure, groupings, types and methodology.
Stock options, warrants and dilutive value of equity calculations.
Enterprise Value components and visualizations.
Ideation
Using divergent and convergent methodology myself and the product manager produced multiple ideas and tested them with our internal stakeholders while simultaneously interviewing clients for concept confirmation. We never stopped the research process and continued to learn about unique calculations and data visualizations popular among firms as we went along.
This was the first project completed entirely remote. Alongside traditional methods like sketching and whiteboarding we got scrappy and began to develop new forms of collaborative using Excel and Google Sheets to collaborate on IA, calculation structure, and DataViz concepts.

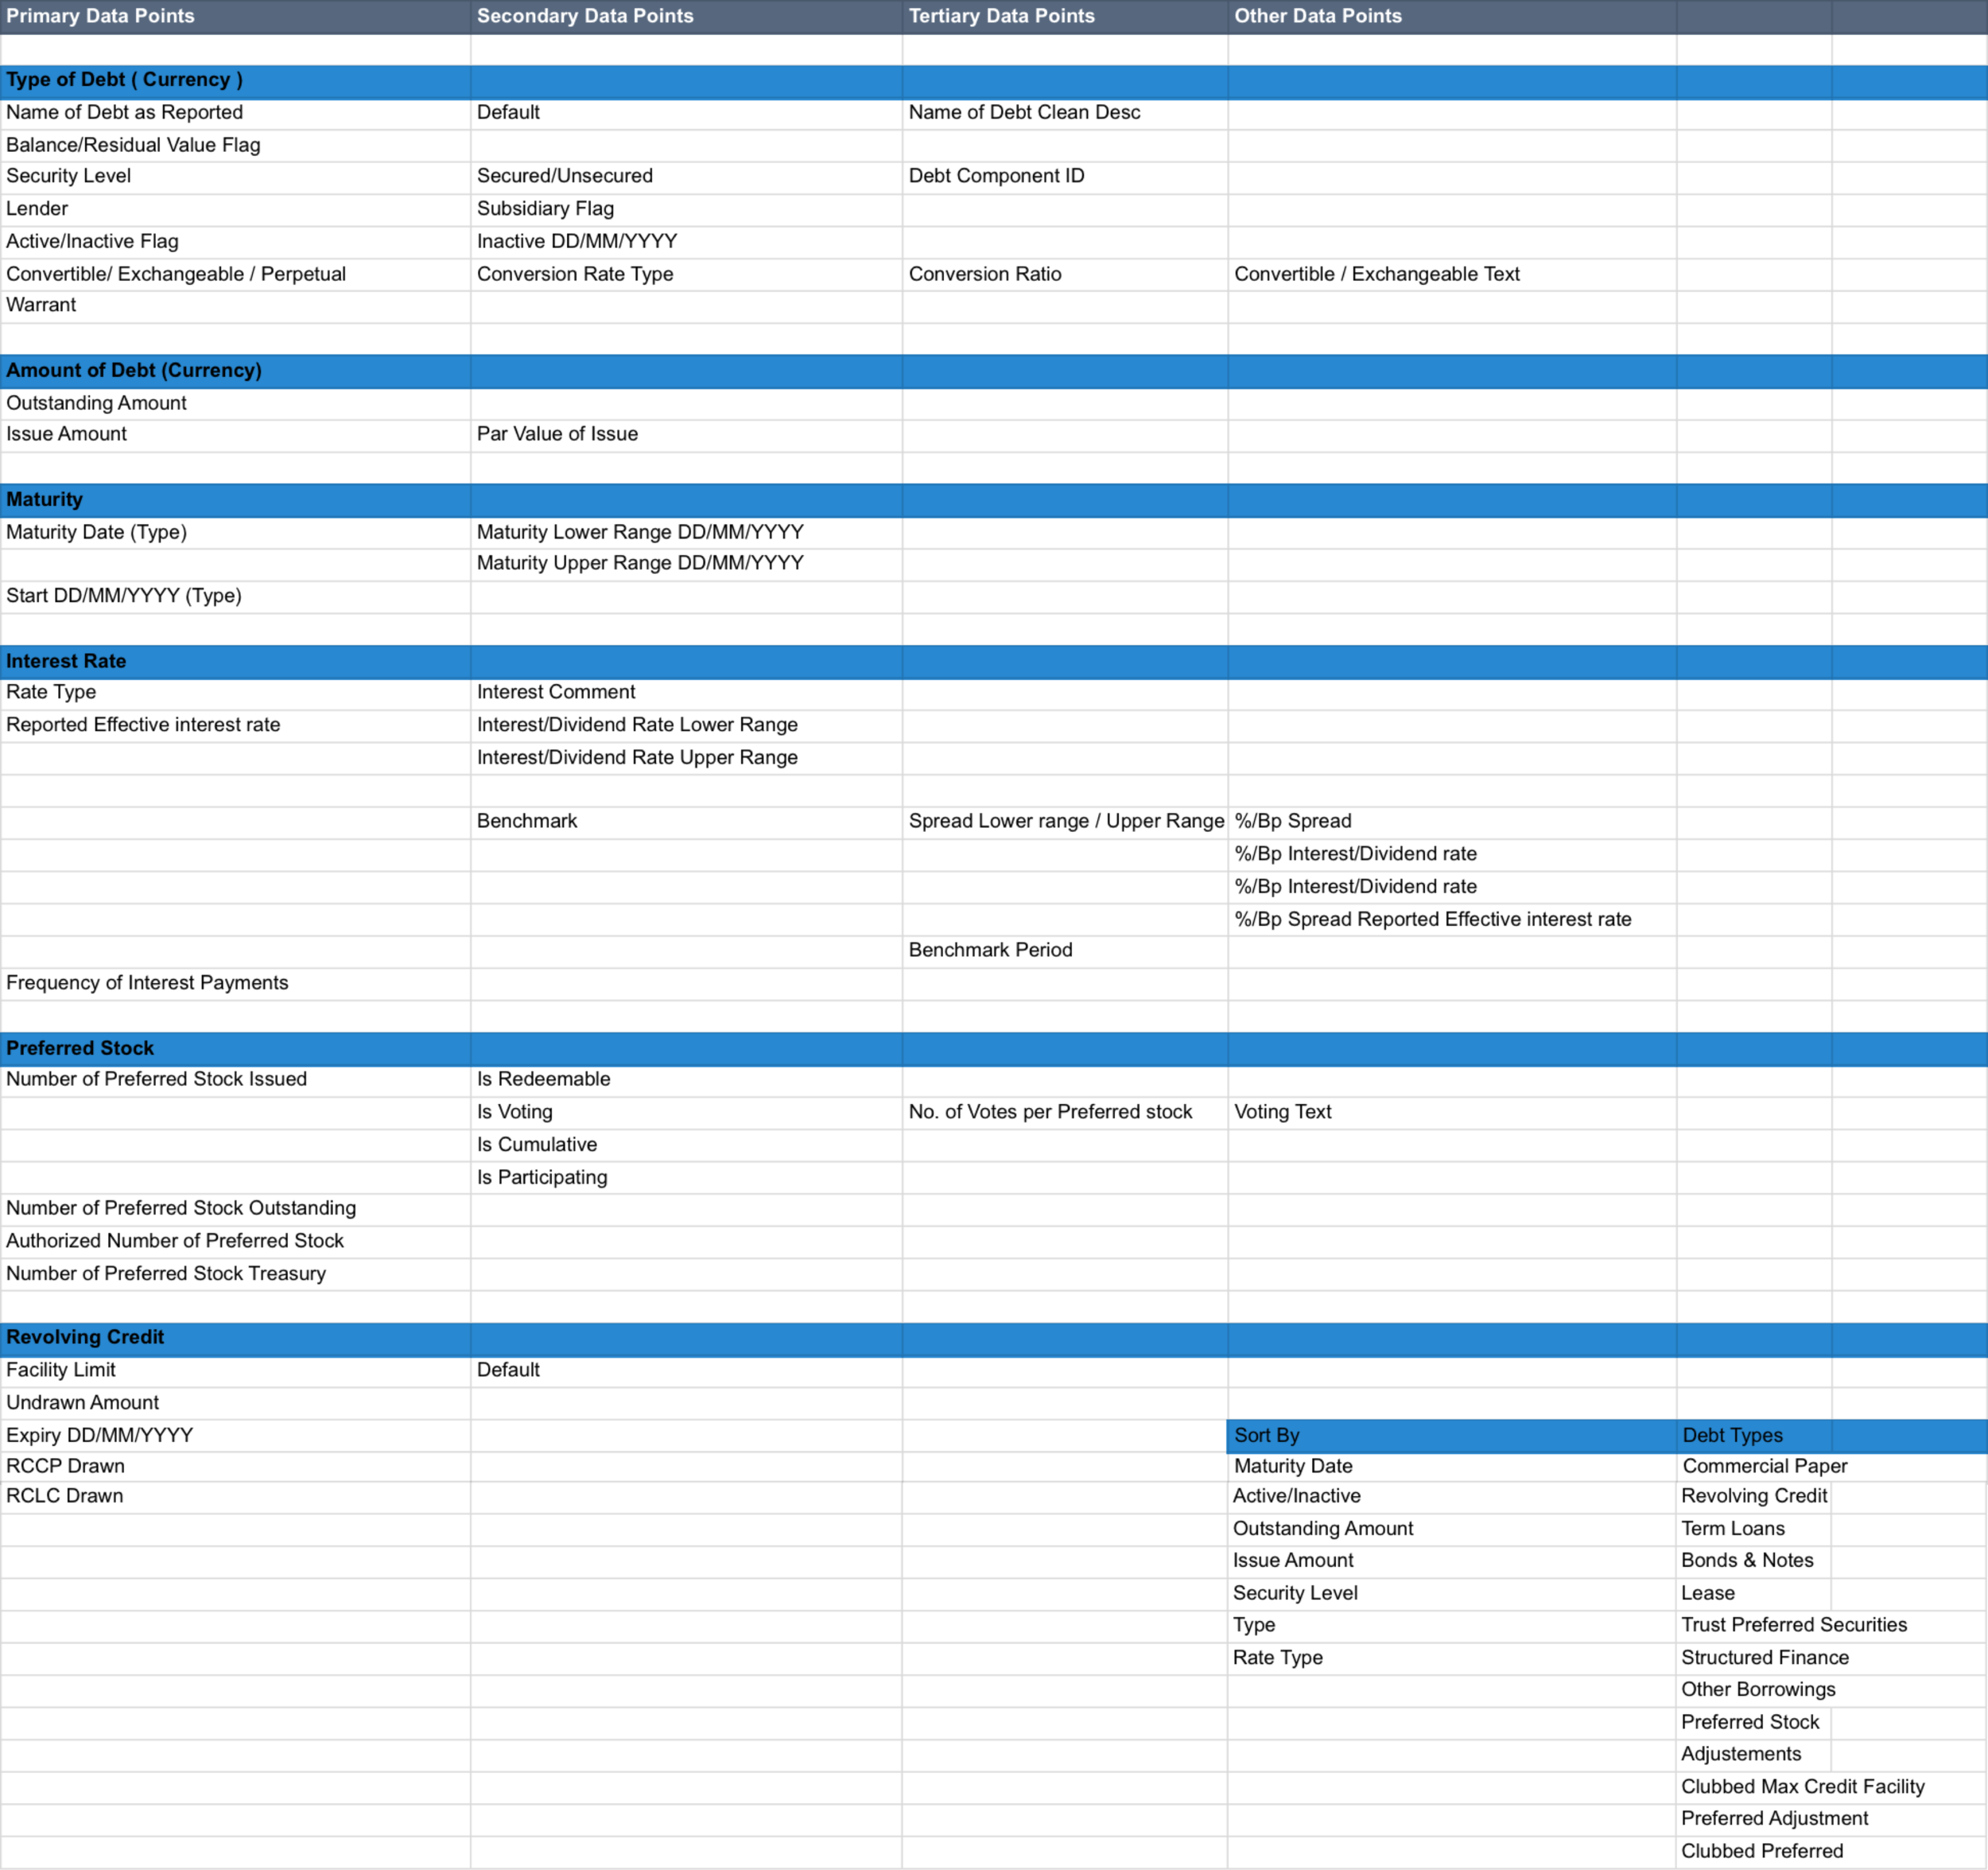
Paper Prototyping
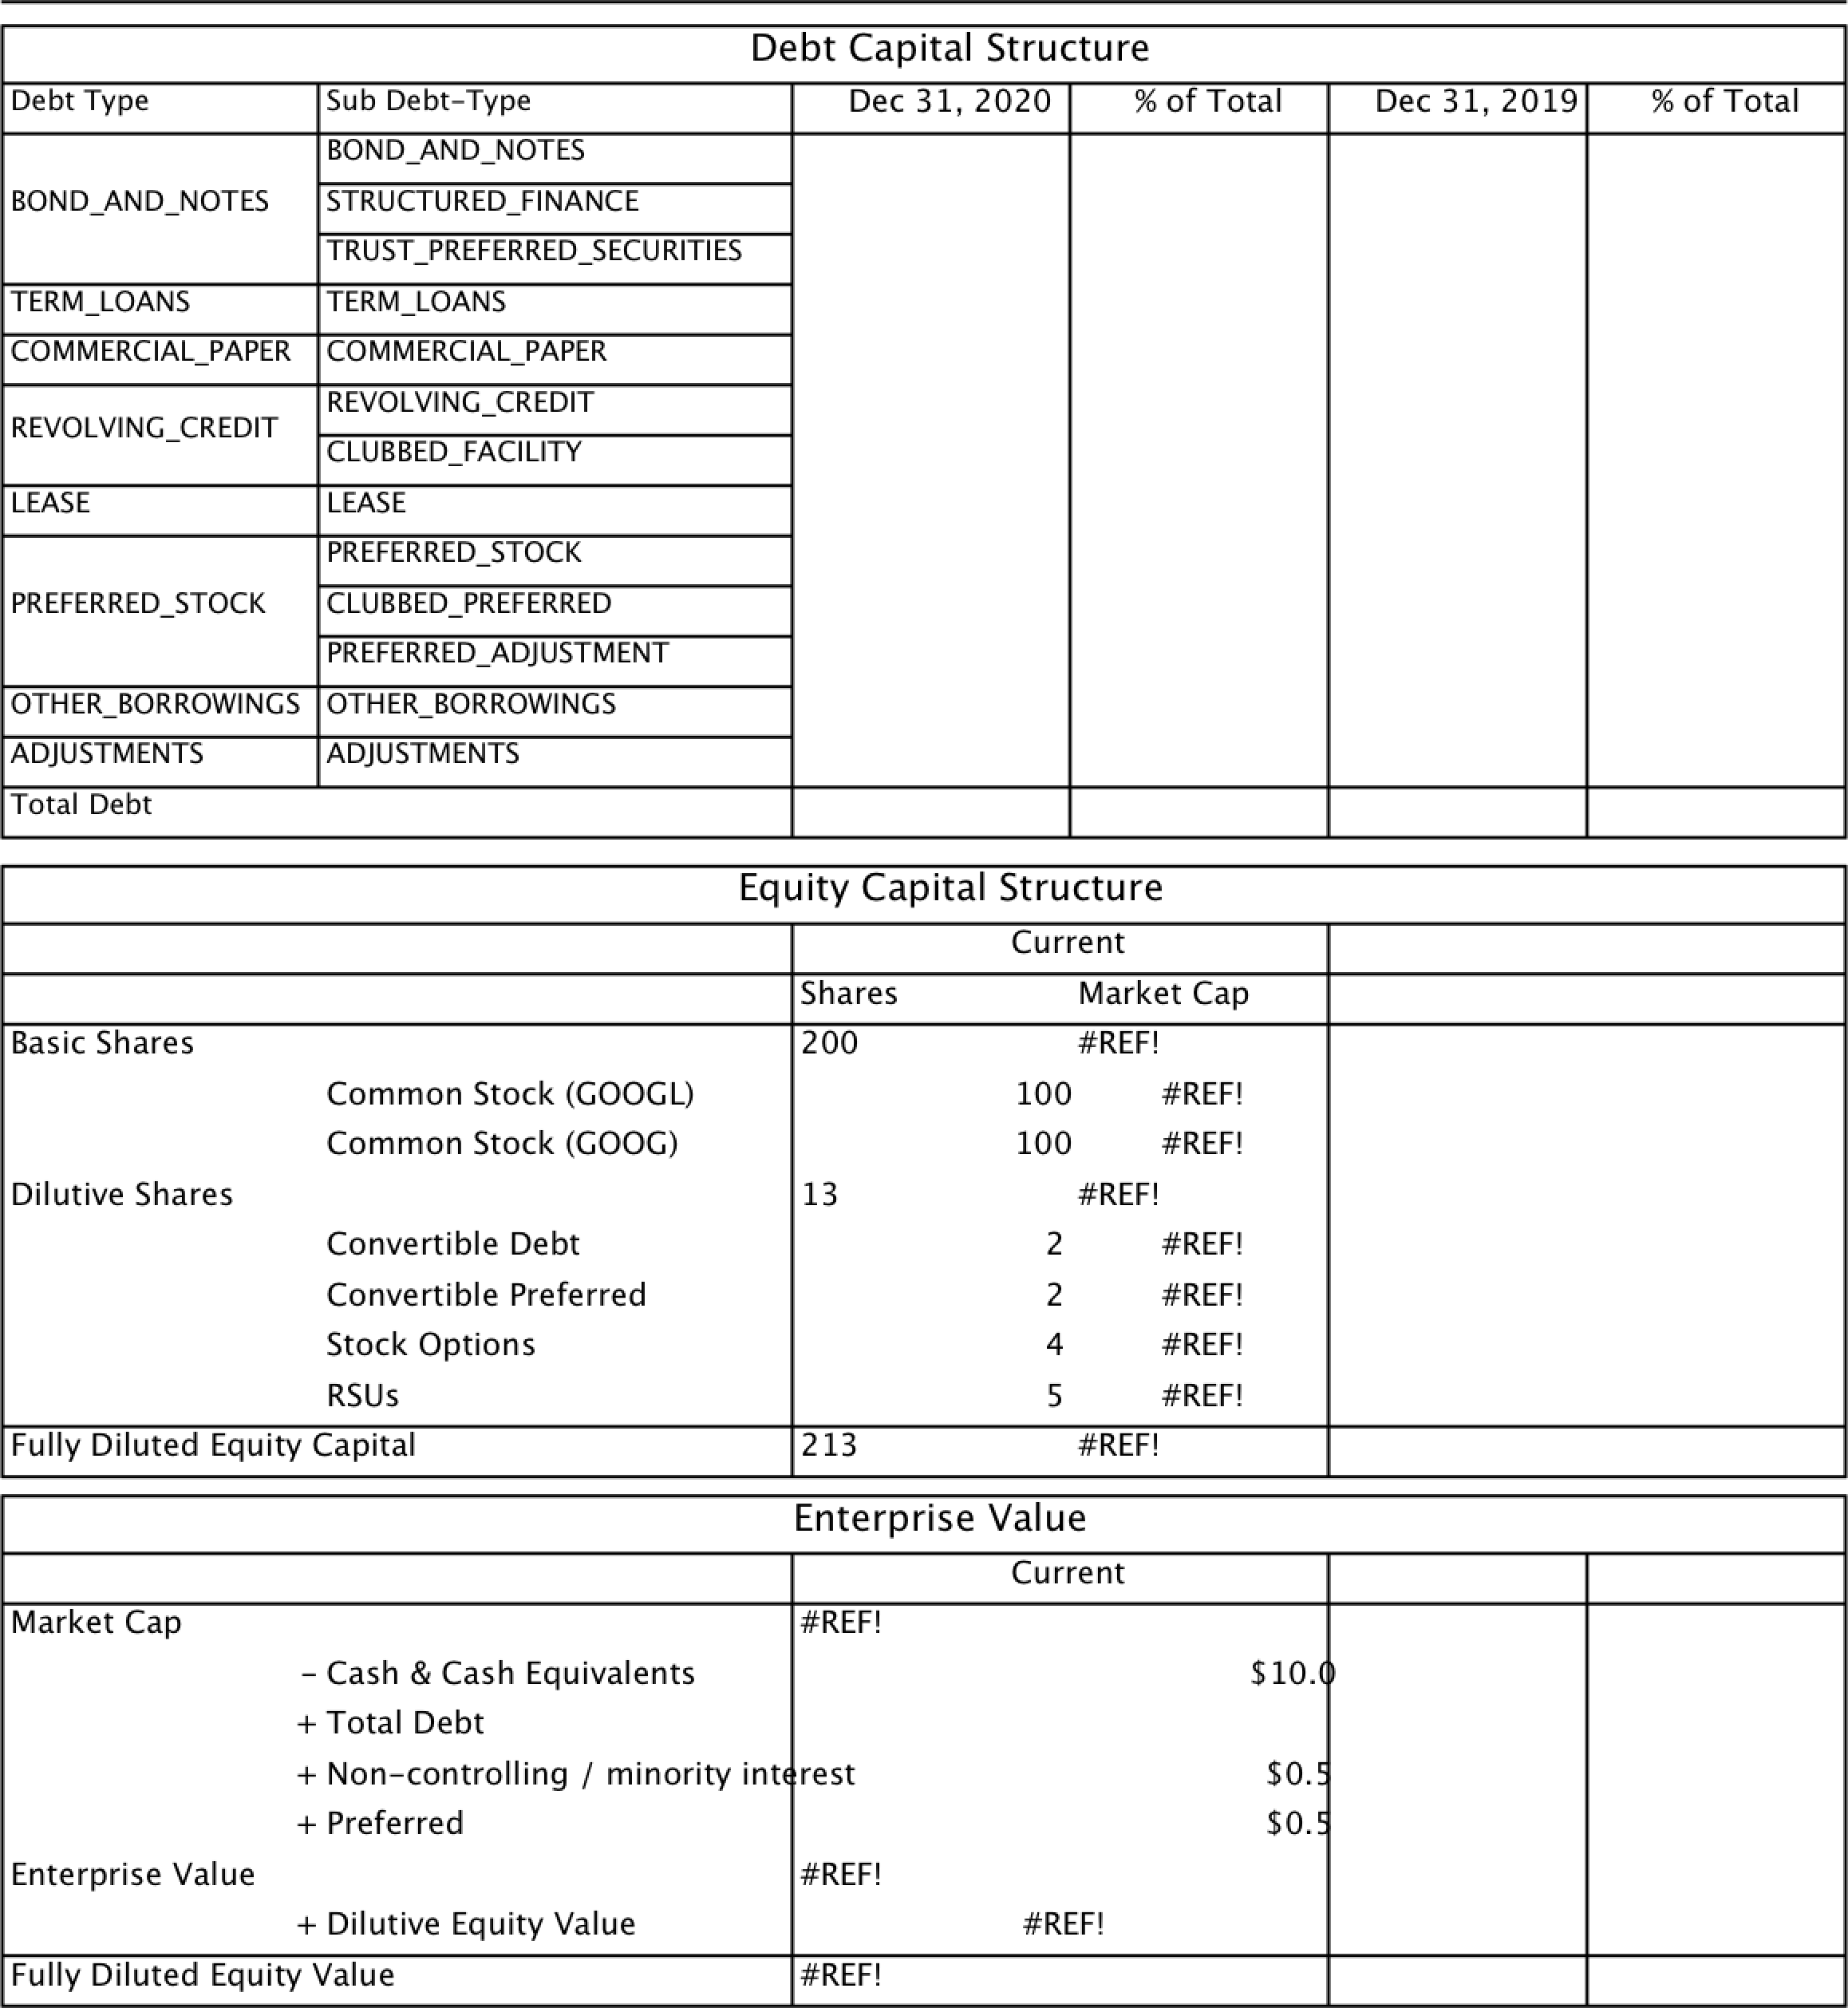
I used paper prototyping to help understand the layout and hierarchy of the page. Where the data visualizations worked best, in what form, and where.
Paper prototyping was a pivotal moment. With the ability to move components around, the structure lended itself to forming an actual equation as the user moved down a single page. I immediately began iterating on a single page view vs. multi-tab experience.
I was also able to better test out criteria and customizations the user might need. This lead to additional filters and sorting options on the data tables, and a new pattern for customizing the variables in some data visualizations.
Takeaways: New interactions for customizations and criteria building, a shift from a multi-tab view to a single page equation based layout, and the prioritization of data visualizations.

We evaluated the paper prototypes with internal stakeholders and I was able to speak on the decision made via this paper prototype and influence changes I may not have otherwise been able to push through.
Card Sorting
Due to our remote landscape I uploaded a version of this paper prototype into Miro and ran a card sort with users. The result confirmed the value in a single page calculation-based format.
Takeaways: Overall calculation methodology. Confirmation of information architecture and relevance of data visualizations. Addition of Equity Capital Structure section.
Responsive Design
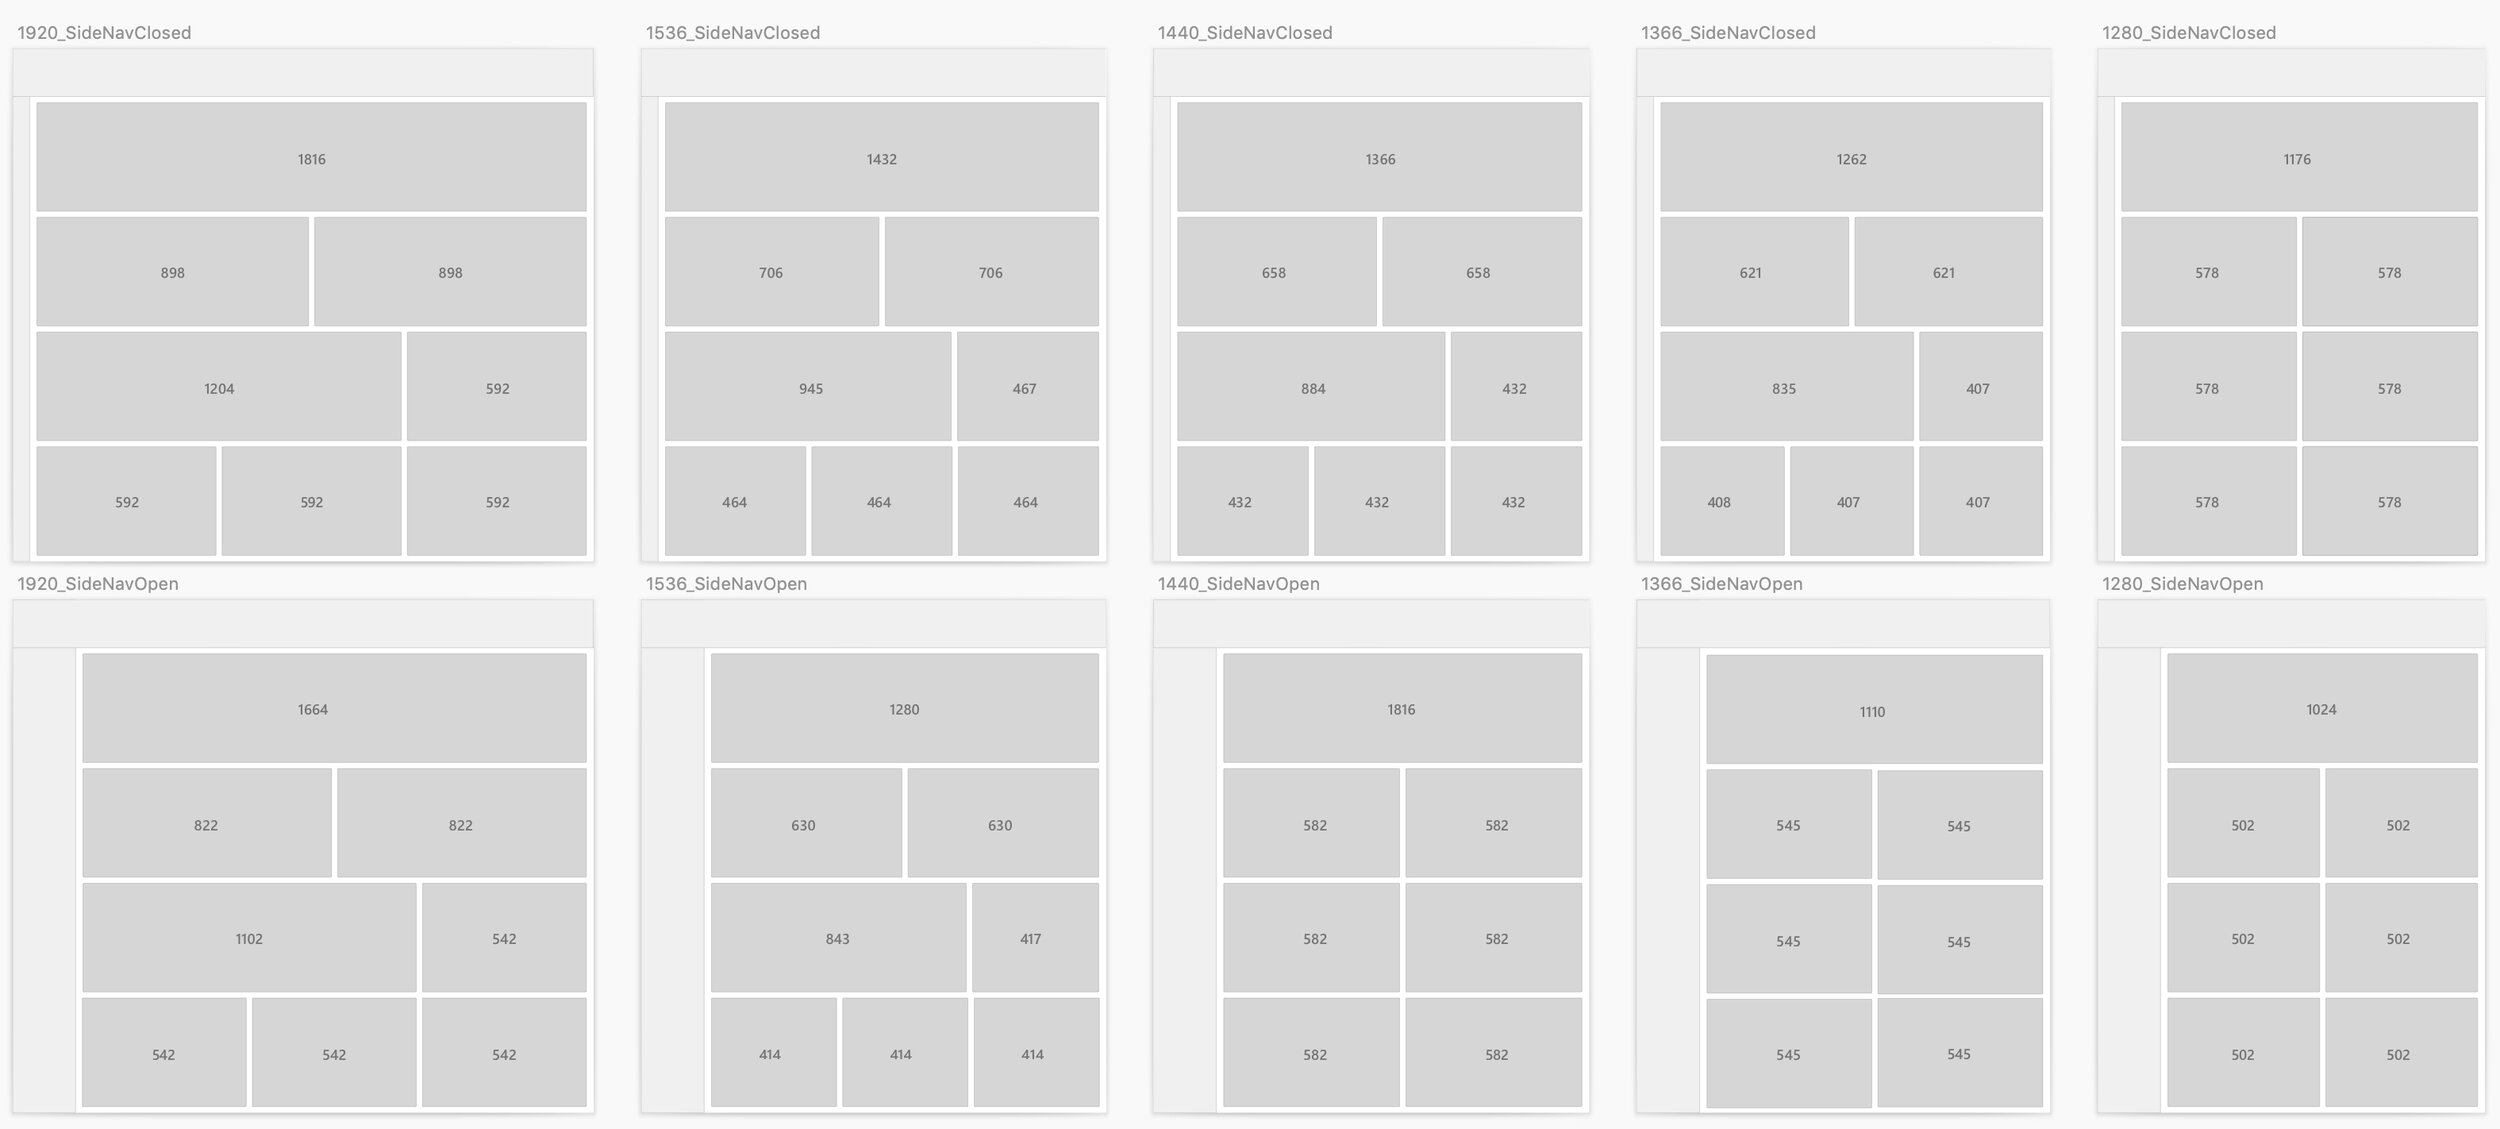
I created an adaptive grid system for this page. These patterns will be implemented across multiple public data page updates after the release of this feature. The new page was the perfect chance to work with dev on forming a more cohesive pattern in page development.
Visual Design
Working within the context of PitchBook’s design library my visual strategy was to prioritize data first; simplifying complexity with out reducing functionality. I highlighted the most important components and interactions through a clear hierarchy. I kept interactions simple, allowing users to move quickly and efficiently. This design fades into the background as the user glides through their analysis.

Next Steps
1 Data feed testing
2 Excel Plugin Experience
3 Private Company Capital Structure
4 Post-release usage data collection
5 Post-release user testing

